
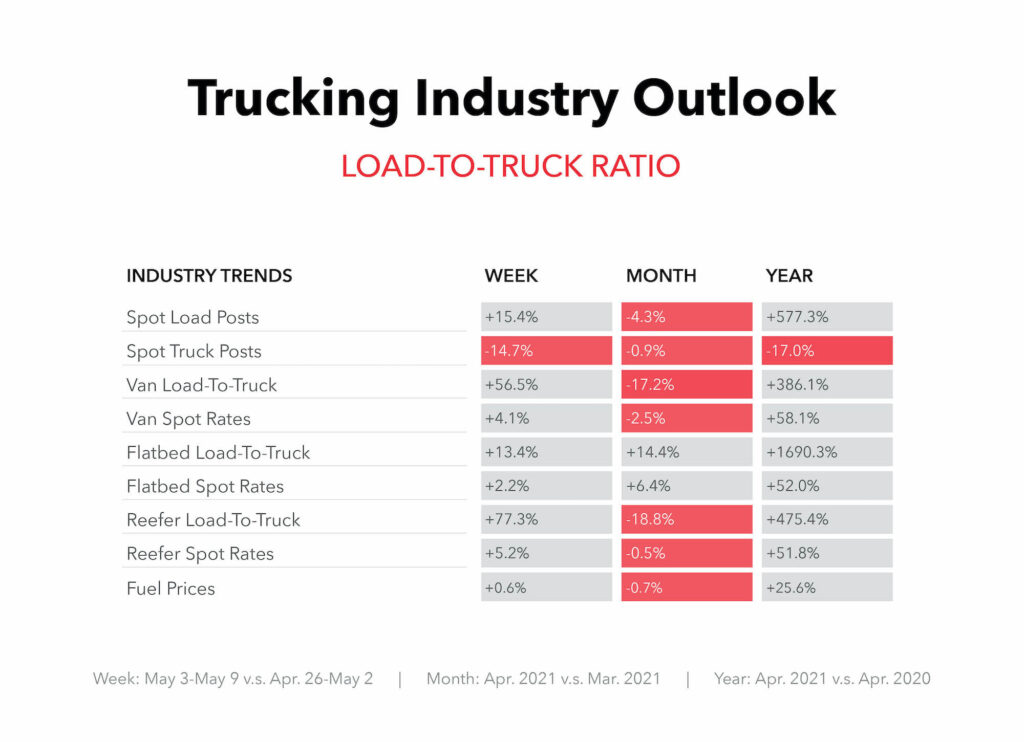
Load-To-Truck Ratio (L/T) is the number of loads posted for every posted truck available. It is a real-time indicator of market demand and trucking supply — it tells us how tight capacity is and how rates are going to change.
Load-To-Truck Ratio:
- Flatbed L/T increased 1,690% year-over-year.
- Spot Load Posts are up 527% year-over-year, while Spot Truck Posts are down 17%.
Implications:
- Load-To-Truck Ratio is still extremely high year-over-year, leading to tight capacity and high spot rates.
- Spot Truck Posts should increase as driver employment With shipment volume continuing to outpace driver recruitment, spot load posts will rise more while spot truck posts could remain relatively stable. This will lead to spot rates rising further.
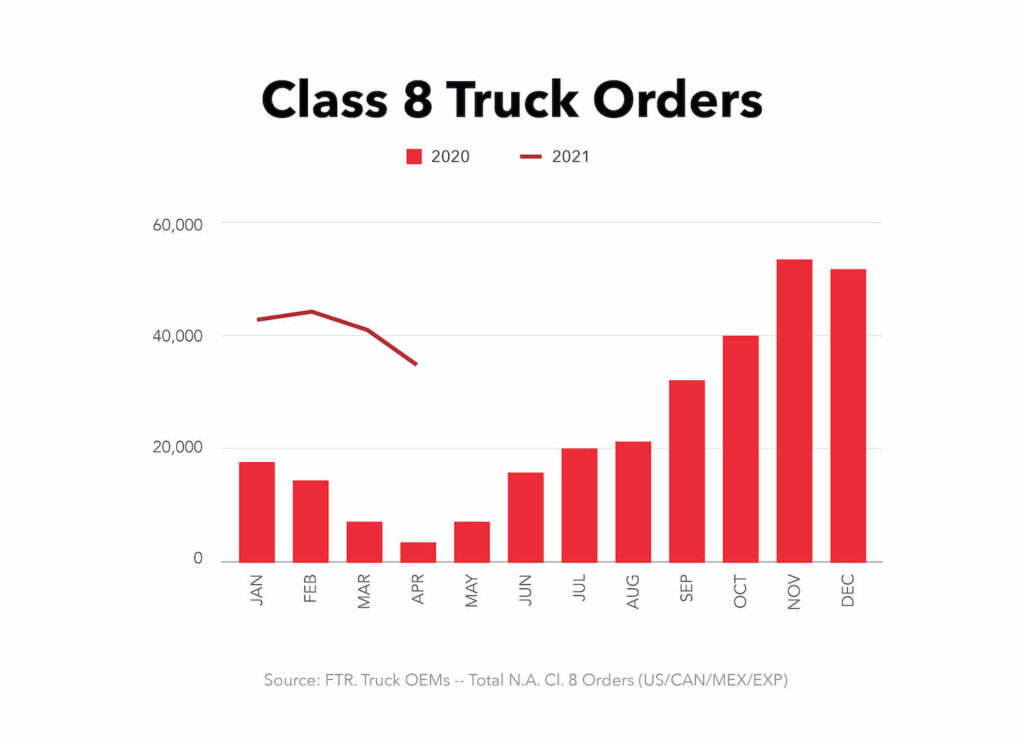
Near the end of 2020, Class 8 Truck Orders skyrocketed to ~40,000 in October, ~57,000 in November, and ~56,000 in December, respectively. This is a 159% increase from October, November, and December of 2019. In the first 3 months of 2021, truck orders were about 43,000 in January, 44,000 in February, and 41,000 in March, far higher than the same months last year. April 2021 truck orders dipped to 34,600, following the trend from 2020.
Implications:
- Trucking companies are looking to increase and upgrade their fleets.
- Truck driver supply should continue increasing.
- These truck order numbers resemble those last seen in July and August of 2018, as spot rates hit multiyear highs.
Reasons for Order Surge:
- Successful vaccine results stalled uncertainty about COVID-19.
- Carriers want to upgrade their fleets with new trucks.
- Carriers are looking to add drivers to their fleets.
Included below is a graph to illustrate the correlation between new truck orders and employment increases from 2015-2019. Truck orders surged at the end of 2017 and 2018, which was followed by employment surges 6-8 months later when those trucks were delivered.

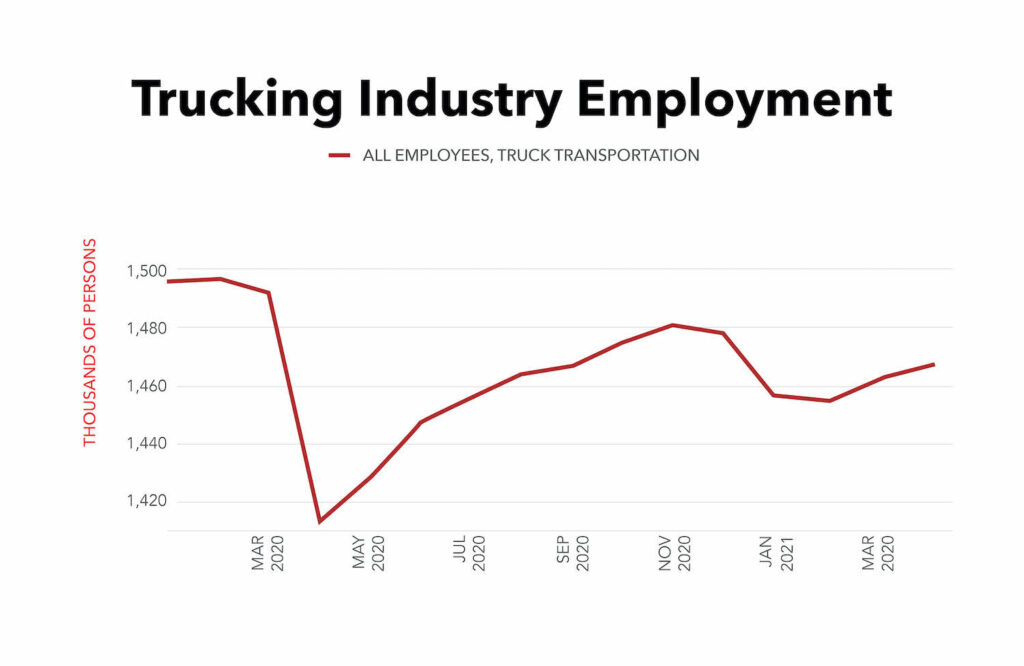
Source: Bureau of Labor Statistics
Source: Federal Reserve Bank of St. Louis
The Bureau of Labor Statistics (NAICS 484) released the data for non-seasonally adjusted employment numbers in the trucking industry.
Considerations:
- There were strong increases in seasonally-adjusted trucking employment April through December.
- Trucking employment decreased between December 2020 and February 2021 but increased again in March and April.
Implications:
- An increase in driver supply is beneficial for the economy.
- Driver recruitment challenges remain constant due to COVID-19 protocols. While driver employment increases, driver training school constraints may cause a slower increase in employment throughout 2021.
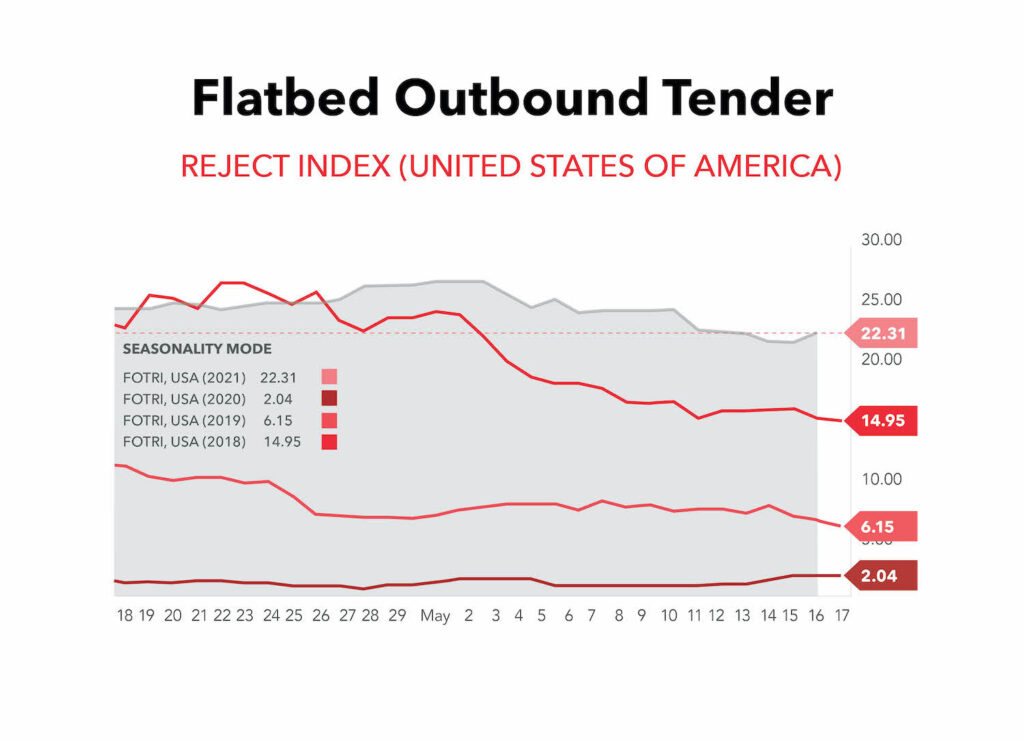
Source: FreightWaves Sonar
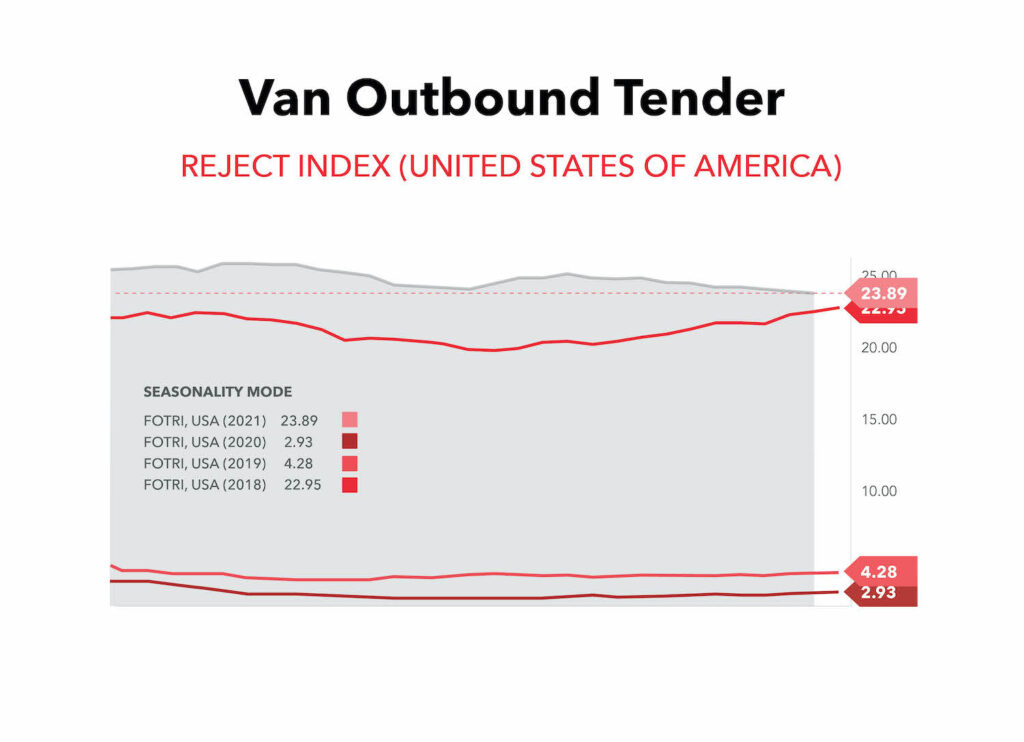
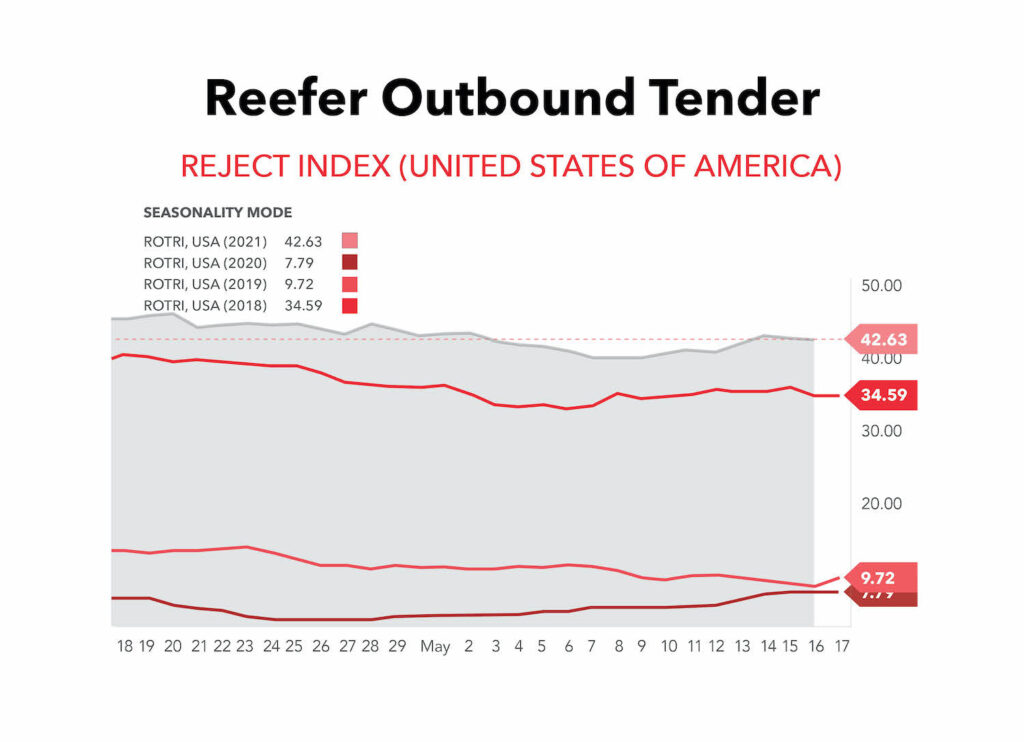
- Outbound Tenders are contractual shipments that can be rejected by the carrier.
- Higher tender rejections lead to higher spot market rates.
- The Tender Rejection Index is the best indicator for spot rates.
- Tender Rejections remain high (reefers at 43%, dry van at 24%, then flatbeds at 22%).
- A 43% National Reefer Tender Rejection Rate means that every 43/100 contracted reefer shipments are being rejected and turned to the spot market.
- A Tender Rejection Rate above 7-10% usually indicates that spot rates are higher than contract rates.
Volume Outlook
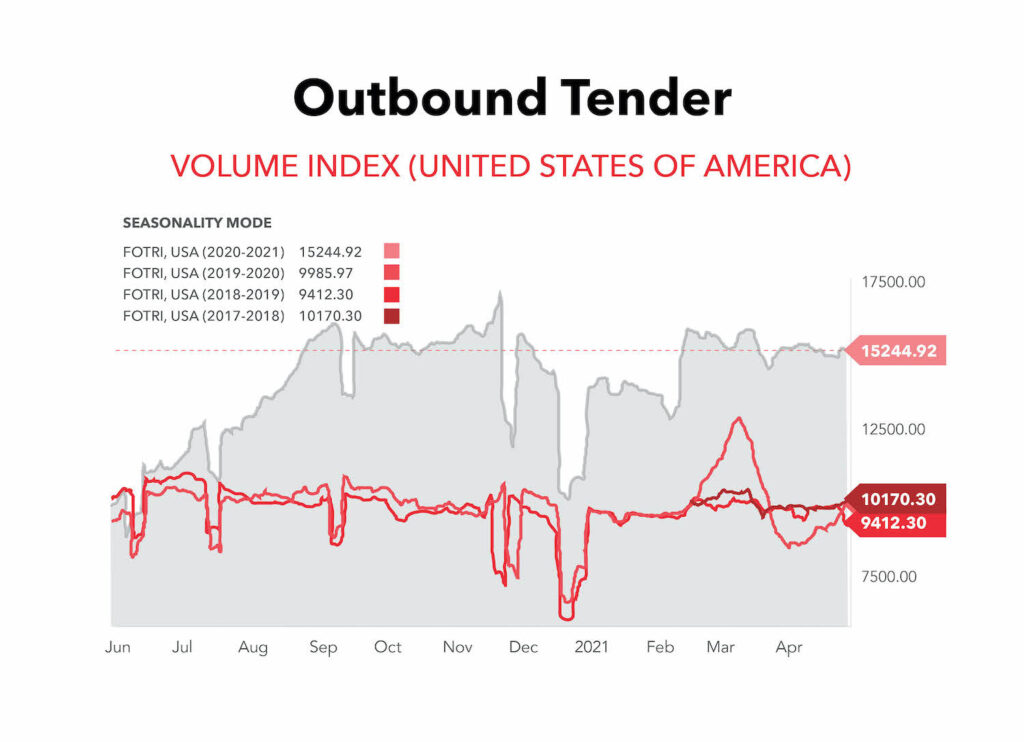
Source: FreightWaves Sonar
- Outbound Tender Volumes remain far higher than the previous 3 years.
- This suggests strong demand and volume as the manufacturing sector continues to grow and companies replenish their inventories.
- The Total Outbound Tender Volume Index measures contracted freight volume across all modes of transportation.
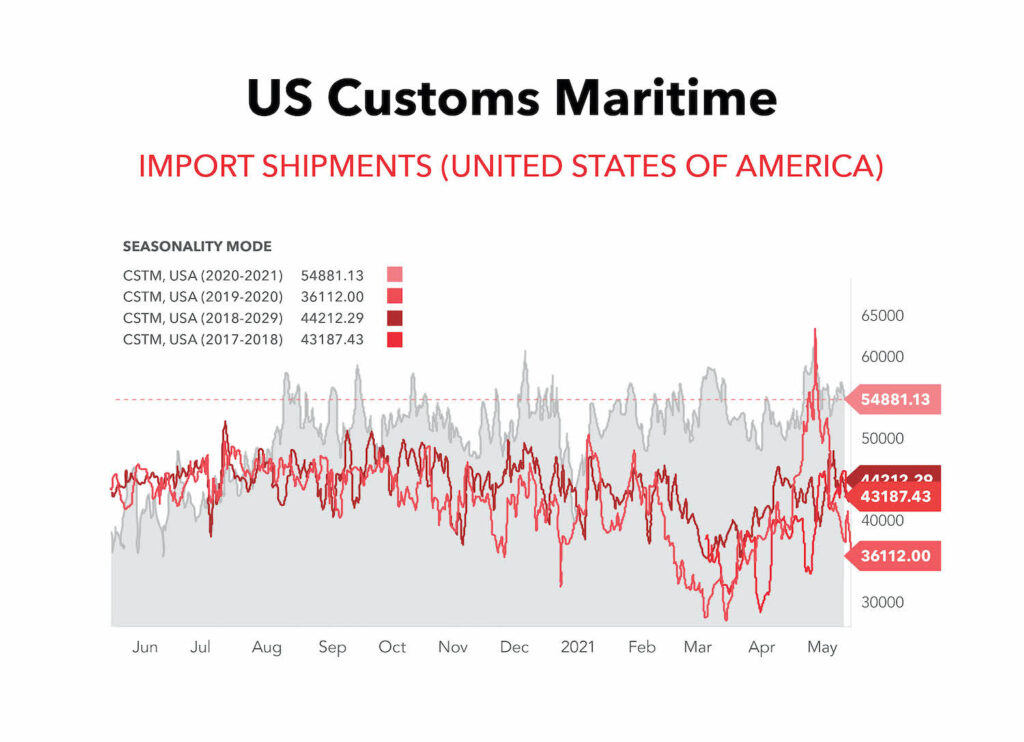
Source: FreightWaves Sonar
- Total import shipments to the U.S. are at 54,881, well above previous 3-year levels as ports are extremely congested and delayed.
- Cargo ship capacity is currently unable to meet demand.
- Distribution centers near the ports are filled as the supply chain is overloaded with goods.
- Strong surges in consumergoods and e-commerce demand during COVID-19 is the main factor in the volume increase and port congestion.
- There will be continuously high volumes coming out of U.S. ports for many coming months.
Economic Outlook
Source: FreightWaves Sonar
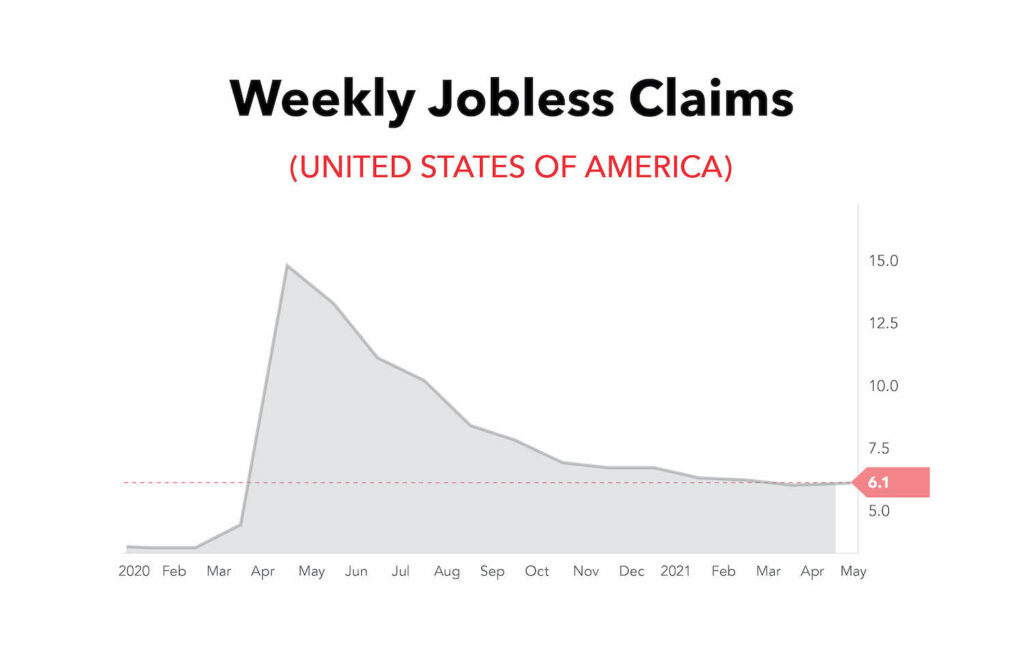
- The unemployment rate is currently down to 6.1%.
- There was a .1% increase in unemployment from March 31st to April 30th.
Source: FreightWaves Sonar
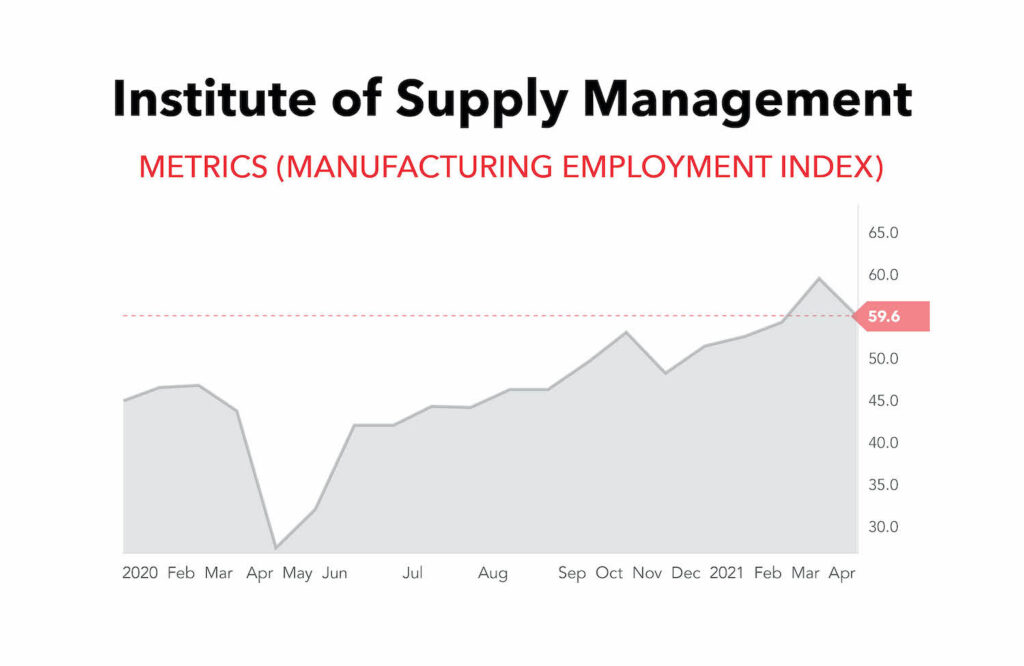
- Manufacturing employment has had a fantastic recovery since the onset of the pandemic.
- As manufacturing employment increases, so should manufacturing output. This will increase flatbed demand.
- Manufacturing employment has a strong positive correlation with flatbed volume.
Source: ISM Report on Business
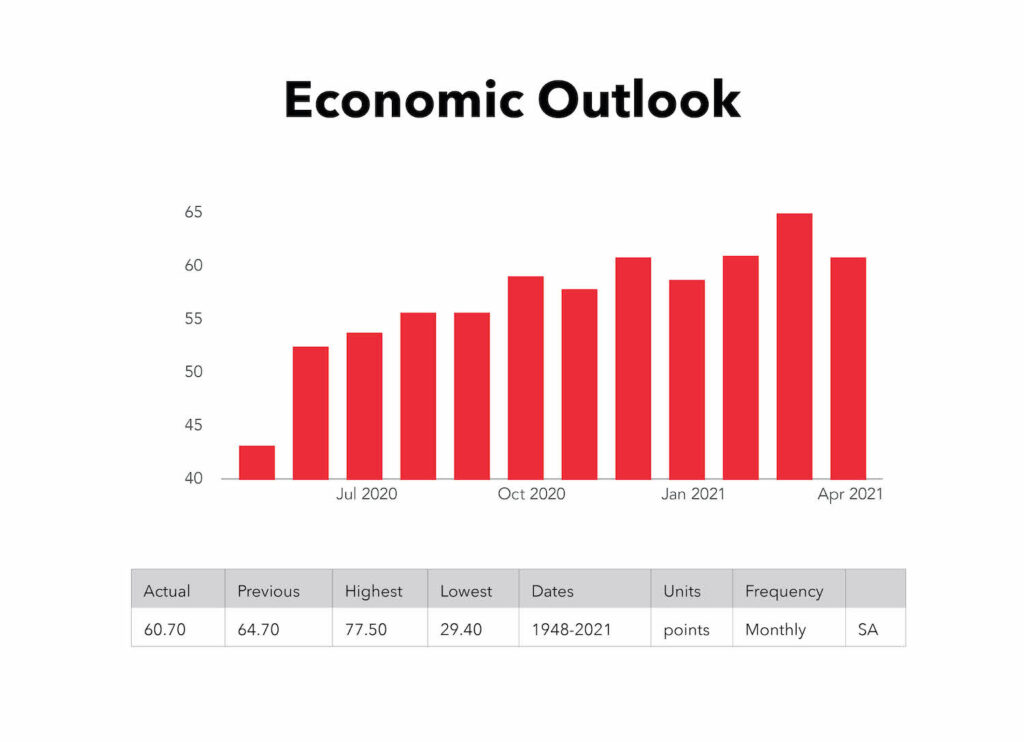
- The ISM Manufacturing Purchasing Manager’s Index (PMI) for the U.S. decreased to 60.7 in April from 64.7 in March, well below forecasts of 65 as shortages of inputs likely caused constrained production.
- March’s reading of 64.7 is the highest reading since December 1983.
- The PMI measures the strength of the manufacturing economy.
- ISM’s chart shows that manufacturing demand is increasing at a high rate.
- The manufacturing economy continued its recovery in April. However, Survey Committee Members reported that their companies and suppliers continue to struggle to meet increasing rates of demand due to coronavirus impacts limiting the availability of parts and materials.
*A PMI reading above 50 indicates that the manufacturing economy is generally expanding; below 50 indicates that it is generally declining.