
Why FWF Market Insights?
Stay up-to-date on industry trends with FWF’s market analysis. The logistics and transportation industry is constantly moving. Understanding the fundamentals of how rates are affected and staying relevant to trends begins with understanding supply and demand. It is vital for your business planning and market knowledge.
If you want to learn more, check out FWF’s Basic Breakdown of Supply and Demand.
Truckload Rates
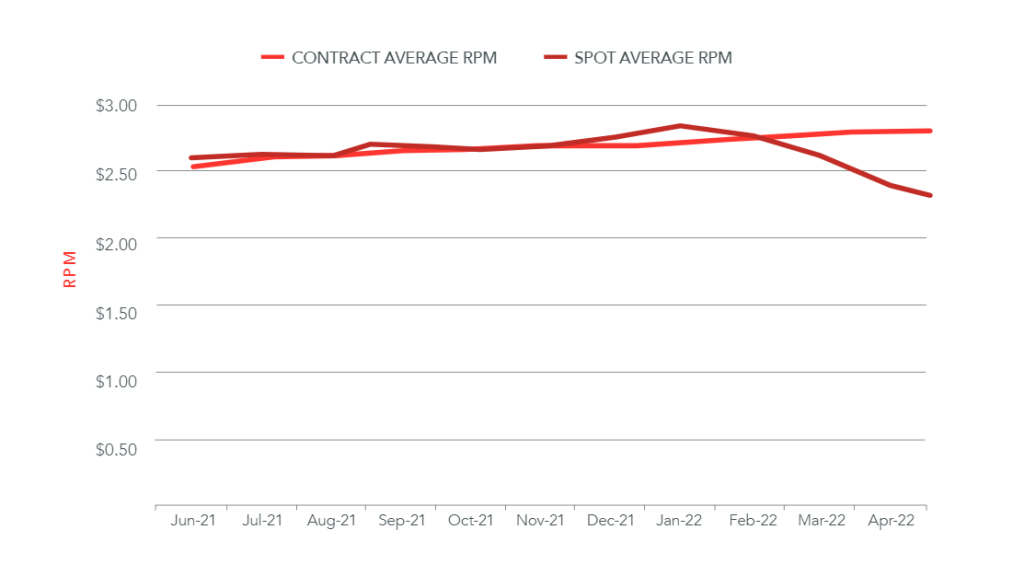
Using spot and contract data from DAT, FWF aggregated the monthly and quarterly linehaul rate-per-mile for reefers, flatbeds, and dry vans to determine the average for all three trailer types combined.
|
Quarterly Contract RPM Excluding Fuel |
Quarterly Spot RPM Excluding Fuel |
|||||
|
Quarter Average |
RPM |
% Change |
Quarter Average |
RPM |
% Change |
|
|
Q3 2021 Average |
$2.62 |
Q3 2021 Average |
$2.63 |
|||
|
Q4 2021 Average |
$2.68 |
+2.3% |
Q4 2021 Average |
$2.70 |
+2.7% |
|
|
Q1 2022 Average |
$2.75 |
+2.6% |
Q1 2022 Average |
$2.74 |
+1.4% |
|
|
Q2 2022 Average |
$2.79 |
+1.4% |
Q2 2022 Average |
$2.31 |
-15.8% |
|
|
Q3 2022 Average |
$2.71 |
-2.6% |
Q3 2022 Average |
$2.13 |
-7.9% |
|
You can find the most up-to-date RPM data by trailer type on DAT.
Typically, contract rates lag behind spot rates by a few months as contracts are given at the beginning of every quarter or year. While spot rates began to fall during the second quarter and into the third quarter of 2022, contract rates held record highs. Carriers were more likely to accept contracted freight as the rates were higher, and in turn, shippers have not had to look to the spot market to secure load coverage as much as they did last year.
During this time of the year, shippers begin to look ahead to their next bids, allowing contract rates to move closer towards spot rate levels. According to FreightWaves, dry van contract rates fell around 5% in August, the first strong downward movement since 2020, followed by another 2.5% decline in early September. Contract rates are expected to continue to decline over the next quarter based on their elevation compared to the spot market, operating ~20% above spot rates. On average, contract rates fell 2.6% in Q3 from Q2.
The flatbed market saw the most significant loosening of capacity in Q3, as flatbed spot linehaul rates declined $0.47/mile from the beginning of June through September. According to DAT, flatbed load posts were 64% lower year-over-year in September, and 10% lower when compared to September 2018. Dry van linehaul spot rates fell ~$0.06/mile and reefers ~$0.12/mile throughout the third quarter, though their spot rates were relatively flat throughout September as activity picked up.
While volume is down significantly compared to the last two years, SONAR’s Outbound Tender Rejection Index remains 15.6% and 22.7% above 2018 and 2019 levels, respectively. A large contributor to the fast decline in rates is less in freight volumes, and more in the number of trucks available in the market. According to DAT, equipment posts on their load board for all 3 trailer types held at historic highs for all three trailer types as new entrants entered the market at the beginning of the year when rates were extremely attractive. As spot rates deflate and operation costs reach record highs, carriers may eventually be forced to leave the market, though it may be delayed as they have extra cash following one of the best years for carriers.
Diesel Prices
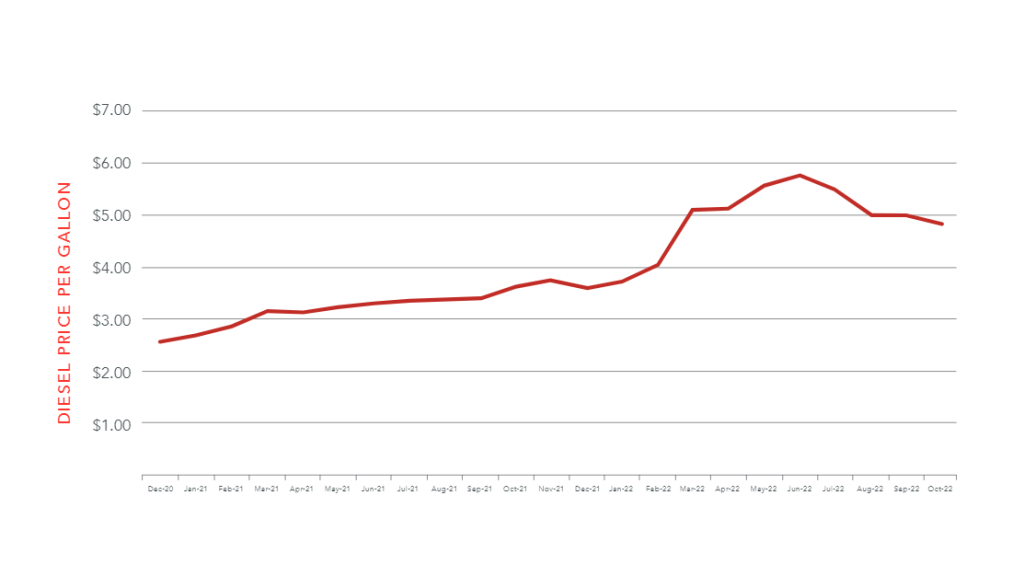
The cost of diesel peaked during the second quarter of the year, reaching a record high in June at a monthly national average of $5.75 per gallon. Following June, the price of diesel eased in all 3 months of Q3, though relatively flat from August to September. According to the EIA, the most recent diesel cost measured $4.84/gallon, a 15.8% decrease from their peak.
According to the EIA’s September Short-Term Energy Outlook, retail diesel prices are forecasted to average $4.90 in the fourth quarter of 2022 and $4.28 in 2023. While the cost of fuel is expected to increase for the remainder of the year, both carriers and shippers can look forward to relief in the next year.
Current Factors Driving the Freight Market
Inflation and Consumer Demand
Inflation continued to put pressure on consumers throughout Q3, and although signs of easing have emerged, there is still a long way down. While September’s Consumer Price Index reading has not been released, CPI rose 0.1% in August on a seasonally adjusted basis after being unchanged in July. Over the last 12 months, the index increased 8.3% (down from 8.5% in July) before seasonal adjustment, with increases in food, shelter, and medical care being the largest contributors. While these increases seem small, inflationary pressures persist for consumers, taking away from consumer demand just ahead of a typically busy holiday spending period.
Retail sales rose 0.3% in August, with a 2.8% increase in automotive, a 1.1% increase in food services, and a 0.9% increase in department stores, though these numbers are not adjusted for inflation and indicate more of a rise in costs as opposed to growing activity. Despite the cooling, consumers are still spending money and retail sales remain elevated far above pre-pandemic levels.
The tight labor market has been a large contributor to consumer strength despite high levels of inflation. Monthly job openings decreased 1.1 million in August, though it remains at a historically high level. Layoffs increased 5.0% while quit rates remained flat, though elevated above pre-covid levels.
Although this signals that the job market may be cooling, it’s far from ‘cool’. The number of unemployed individuals per job opening remains at 0.60, suggesting that workers still have a positive job market to rely on. Quit rates remaining elevated also suggest that workers continue to feel comfortable enough to leave their current employment to secure a better opportunity.
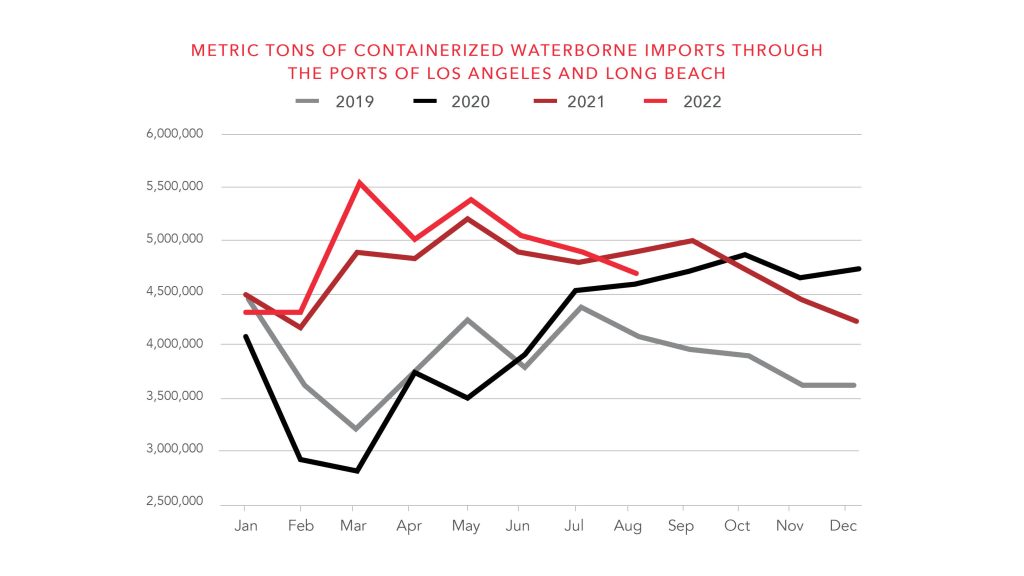
Imports
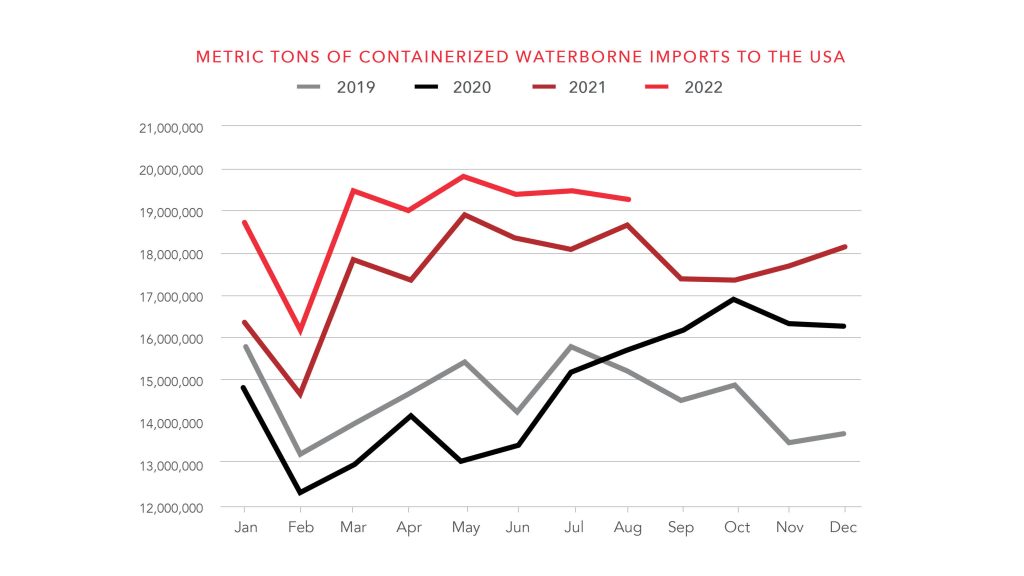
Imports remained strong through the first two months of Q3, though the busiest U.S. port reported a substantial slowdown in volumes. Imports to the Port of Los Angeles, the highest volume port in the country, fell 16.7% m/m and 16.8% y/y in August. Despite the drop on the West Coast, total U.S. container imports remain close to record highs, just 1.8% below August 2021, and are up 18% vs August 2019, highlighting the shift in imports to the other side of the country.
The Port of Savannah’s August imports were up 15.6% m/m, 18.5% y/y, and 34% versus August 2019. This change has also caused congestion to shift, with a reported backlog of ~100 ships waiting to be unloaded off of East Coast ports in September. A substantial amount of volume has also shifted from LA to Long beach, where imports were up 2.2% m/m, confirming import strength despite the port of LA reporting slowed activity.
In September, PIERS reports imports to all U.S. ports were up 1.5% y/y and 13.3% from September 2019. While imports to the West Coast continued to decrease 11.5% y/y and 3.6% compared to 2019, East Coast ports increased 10% y/y and 24% from 2019 and Gulf Coast imports increased 28.4% y/y and 59.3% compared to 2019. The Georgia Ports Authority also reported that Hurricane Ian had an impact on imports as operations were halted for three days. Year-over-year import numbers may weaken in Q4, but consumer demand has not slowed down as expected.
ISM Purchasing Manager’s Index
The Purchasing Manager’s Index (PMI) is a measure of the direction of economic trends in manufacturing. Covering 19 industries, including both upstream and downstream activity, this is a leading indicator of overall economic activity. In the United States, a PMI reading over 50 means the manufacturing economy is expanding, while a reading under 50 means the industry is contracting. When the PMI indicates an expansionary manufacturing economy, volume increases due to increased output.
Economic activity in the manufacturing sector grew in September for the 28th consecutive month, measuring 50.9%, down 1.9 percentage points from August. Although this indicates that the U.S. manufacturing continued to expand, 50.9% is the lowest measure since the pandemic recovery began in May of 2020 and has been decreasing throughout 2022, inching towards a contractionary state.
Conclusion
Q3 of 2022 saw continued normalization of the market, as spot rates continued to decline. Despite the loosening of the market, there are still positive indicators for the short-term outlook. While consumers are challenged with high levels of inflation, there are signs that inflation has peaked. Consumers are also continuing to spend their money despite these pressures, as they have had a strong labor market to rely on. Imports show signs of continued strength, despite the shift from the West Coast to the East and Gulf Coasts. Manufacturing activity in the U.S. has certainly slowed, but September’s measure indicates that it is still expanding.
The fourth quarter of the year is typically the busiest season for freight as shippers look to stock up and move goods ahead of the holiday season . Much like the rest of this year has been, Q4 of 2022’s outlook is uncertain. While volume can be expected related to the upcoming holidays, shipments may be muted and rates may see an increase.
FWF continues to provide customers and carriers with reliable and new information to navigate the freight market with in-depth knowledge and data. Visit FWF’s resource center for more information that can improve your insights.