
Supply and Demand in the Transportation Industry
What is Supply and Demand?
Like any competitive marketplace, prices in the logistics and transportation industry are governed by the laws of supply and demand. Understanding the fundamentals of how transportation rates are affected by supply and demand is vital for your business planning and market knowledge.
The law of supply and demand is the interaction between the seller of a good or product and the demand from the buyer of the good or product. The law states that prices are determined by both how much of a commodity is supplied and how much of that commodity is demanded by consumers.
What is Supply?
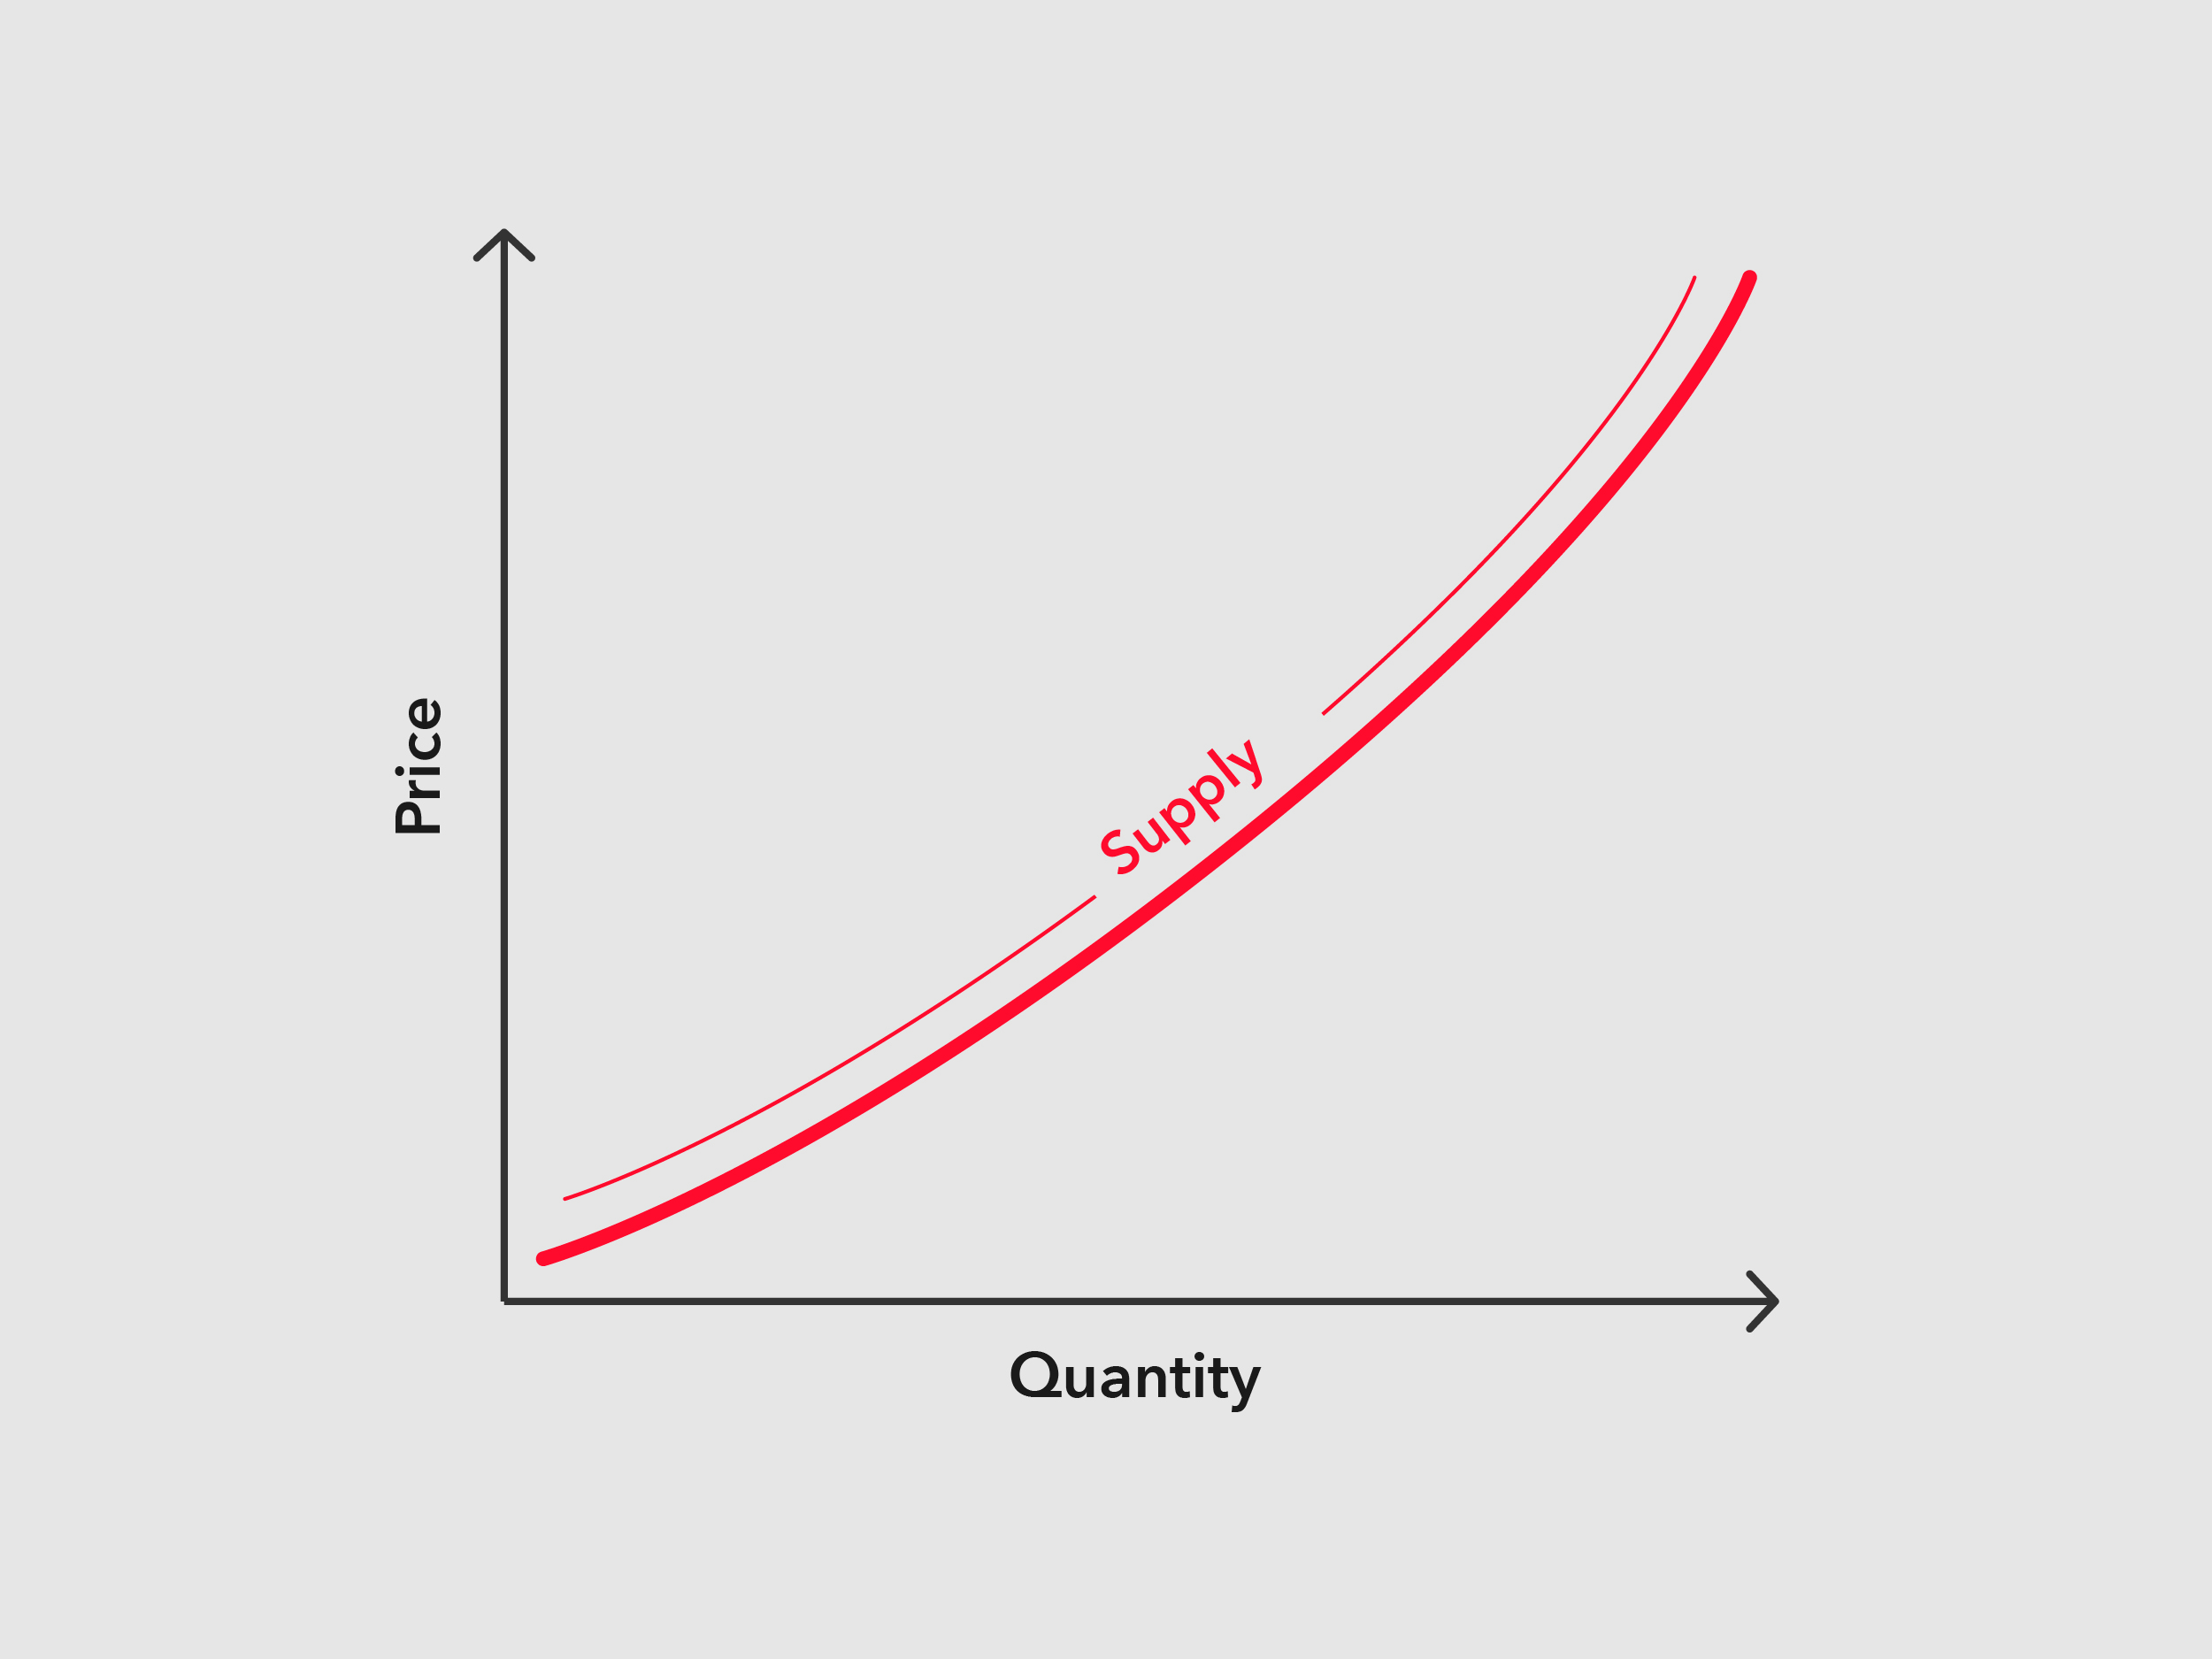
What is often missing from the textbook definition that reigns true in the transportation industry is the level of service; quality service will result in the ability to raise prices.
As price increases, the quantity supplied increases. This law declares if prices increase, producers want to sell more of that commodity in order to increase profits further. As price decreases, the quantity supplied decreases.
What is Demand?
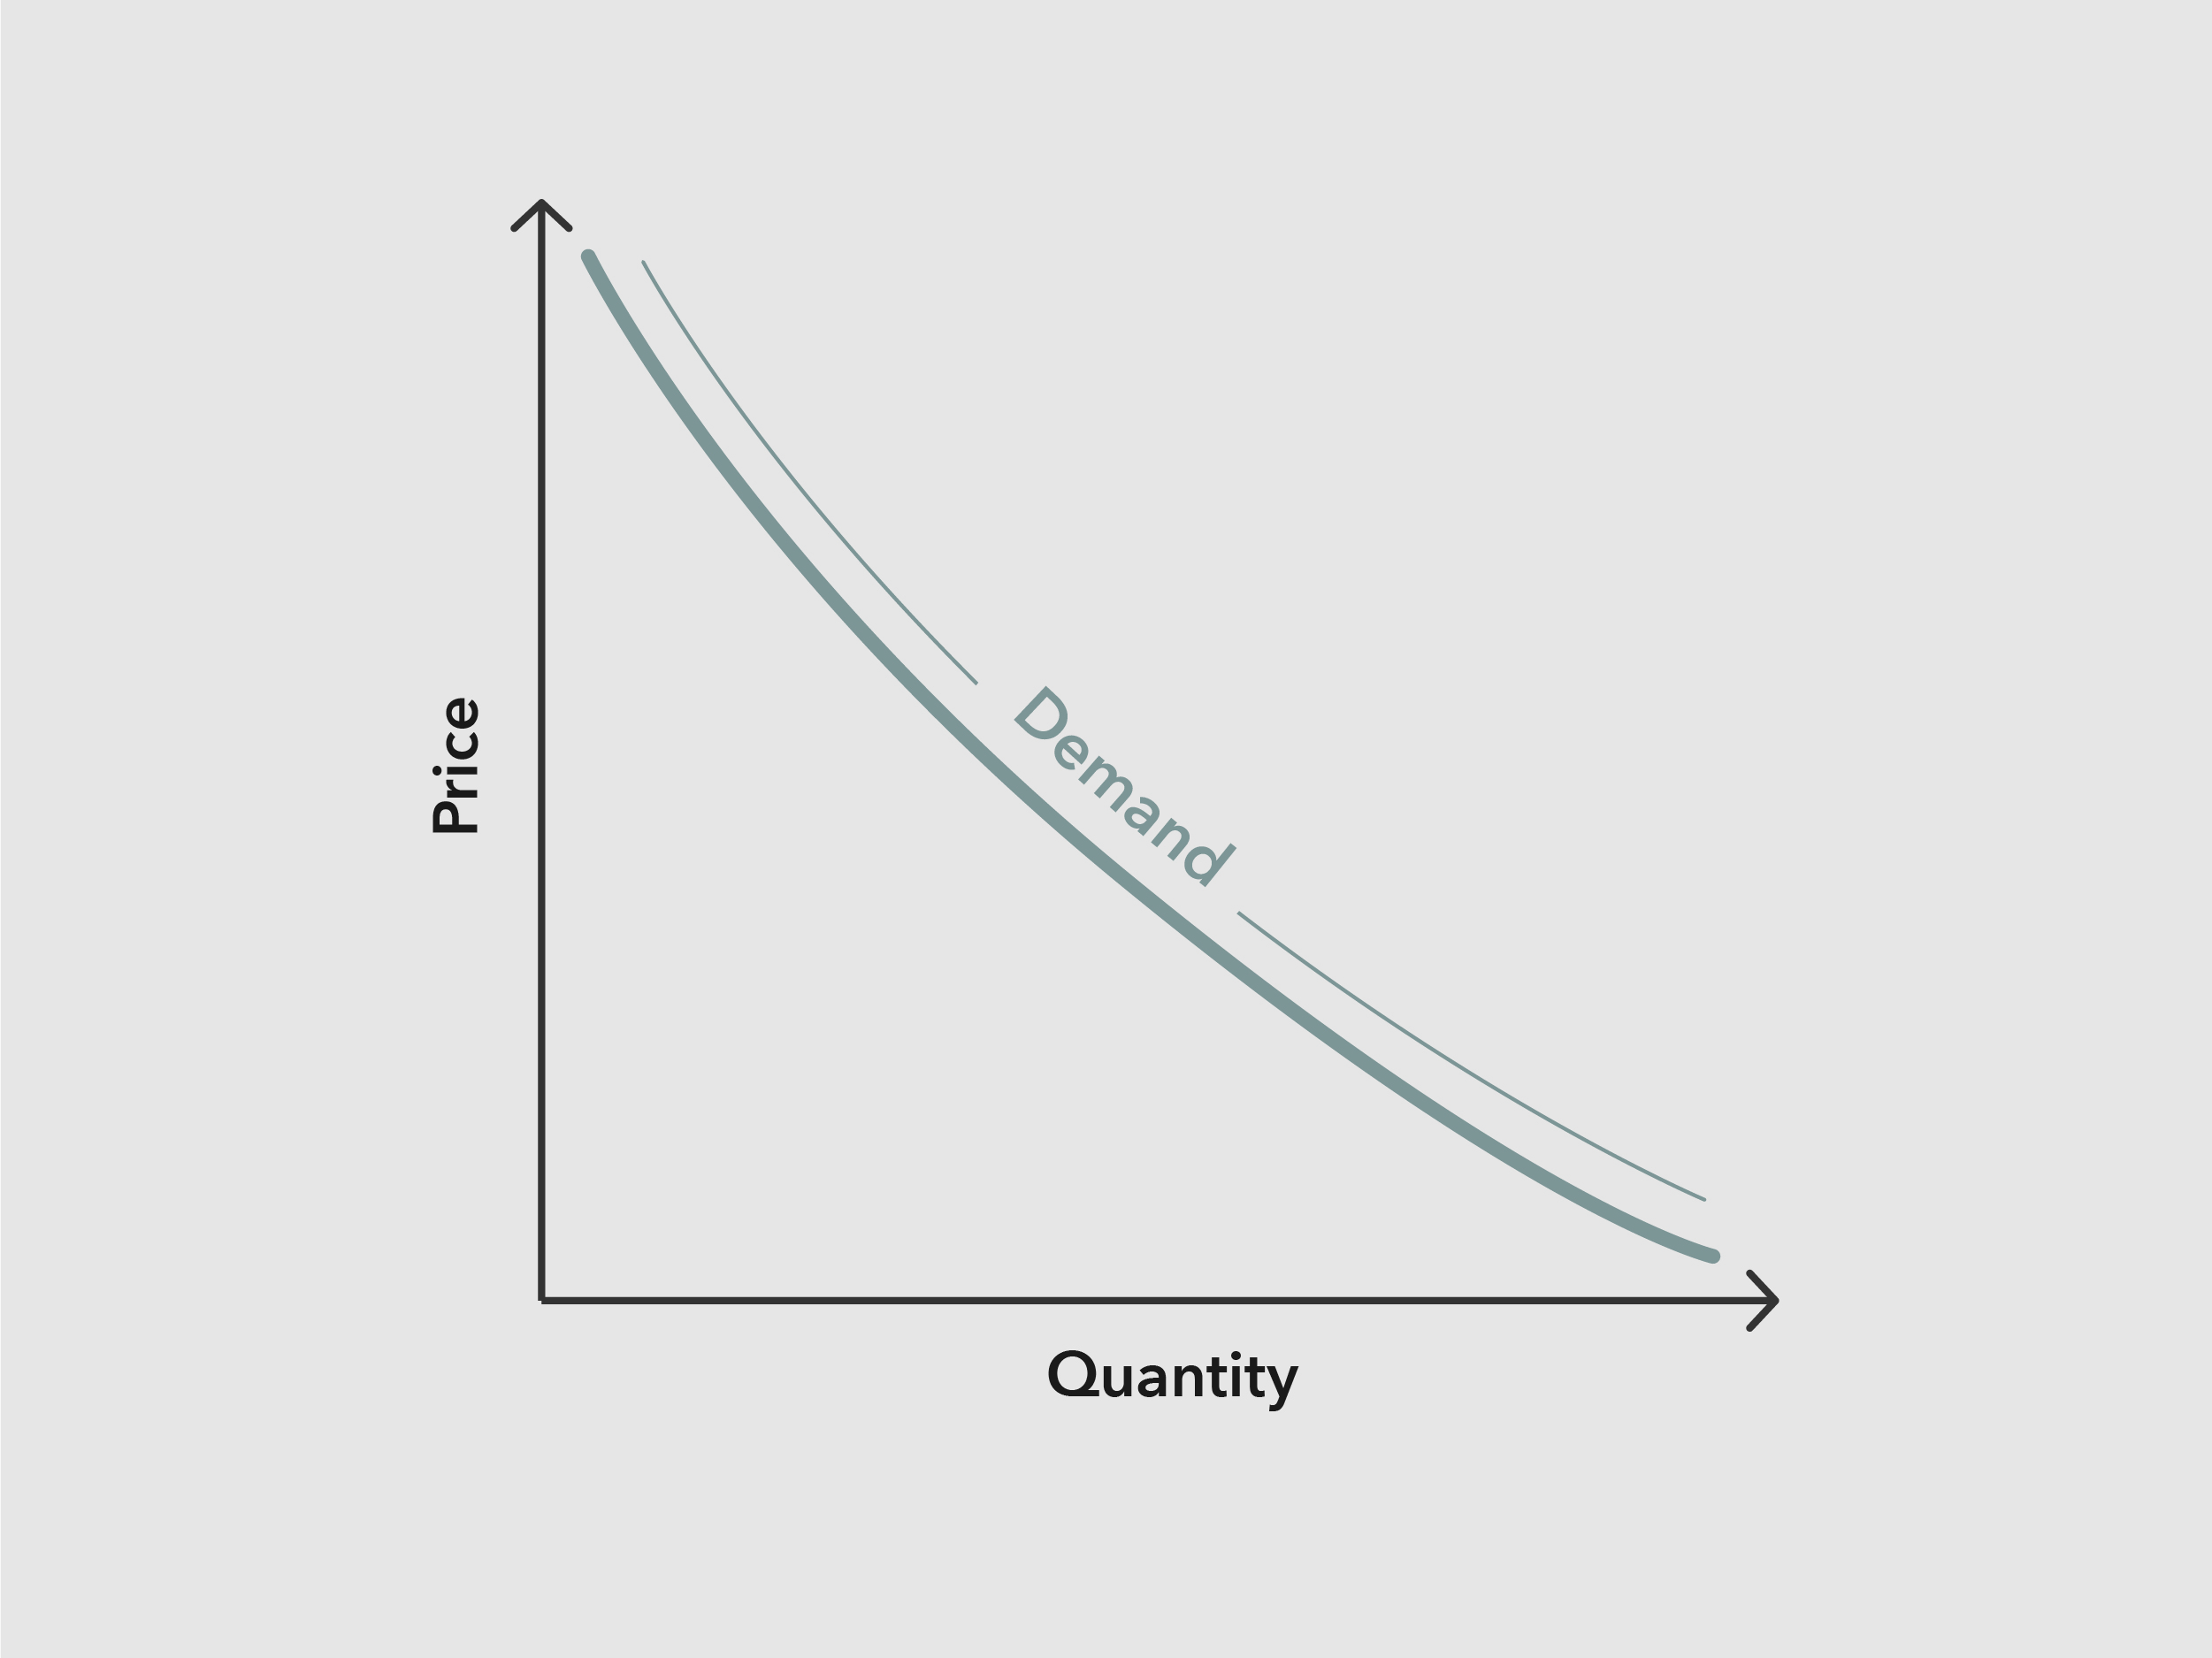
The law of demand is defined as the relationship between the price of a commodity and the quantity demanded by consumers at that price. The demand curve is plotted as a downward-sloped line from left to right.
As price increases, the quantity demanded decreases. This law declares that as the price of a commodity increases, consumer’s willingness to pay decreases. As price decreases, the quantity demanded increases.
Supply and Demand Together
The point at which the supply and demand curve intersect gives us the quantity and price for that commodity. As you can see on the graph above, when supply and demand are equal the point of intersection is called the equilibrium. When this happens, supply and demand are balanced. This tells us the quantity of goods that sellers are supplying is equal to the quantity demanded by buyers. This also indicates there is no surplus or shortage of the commodity.

Supply and Demand Curve Shifts
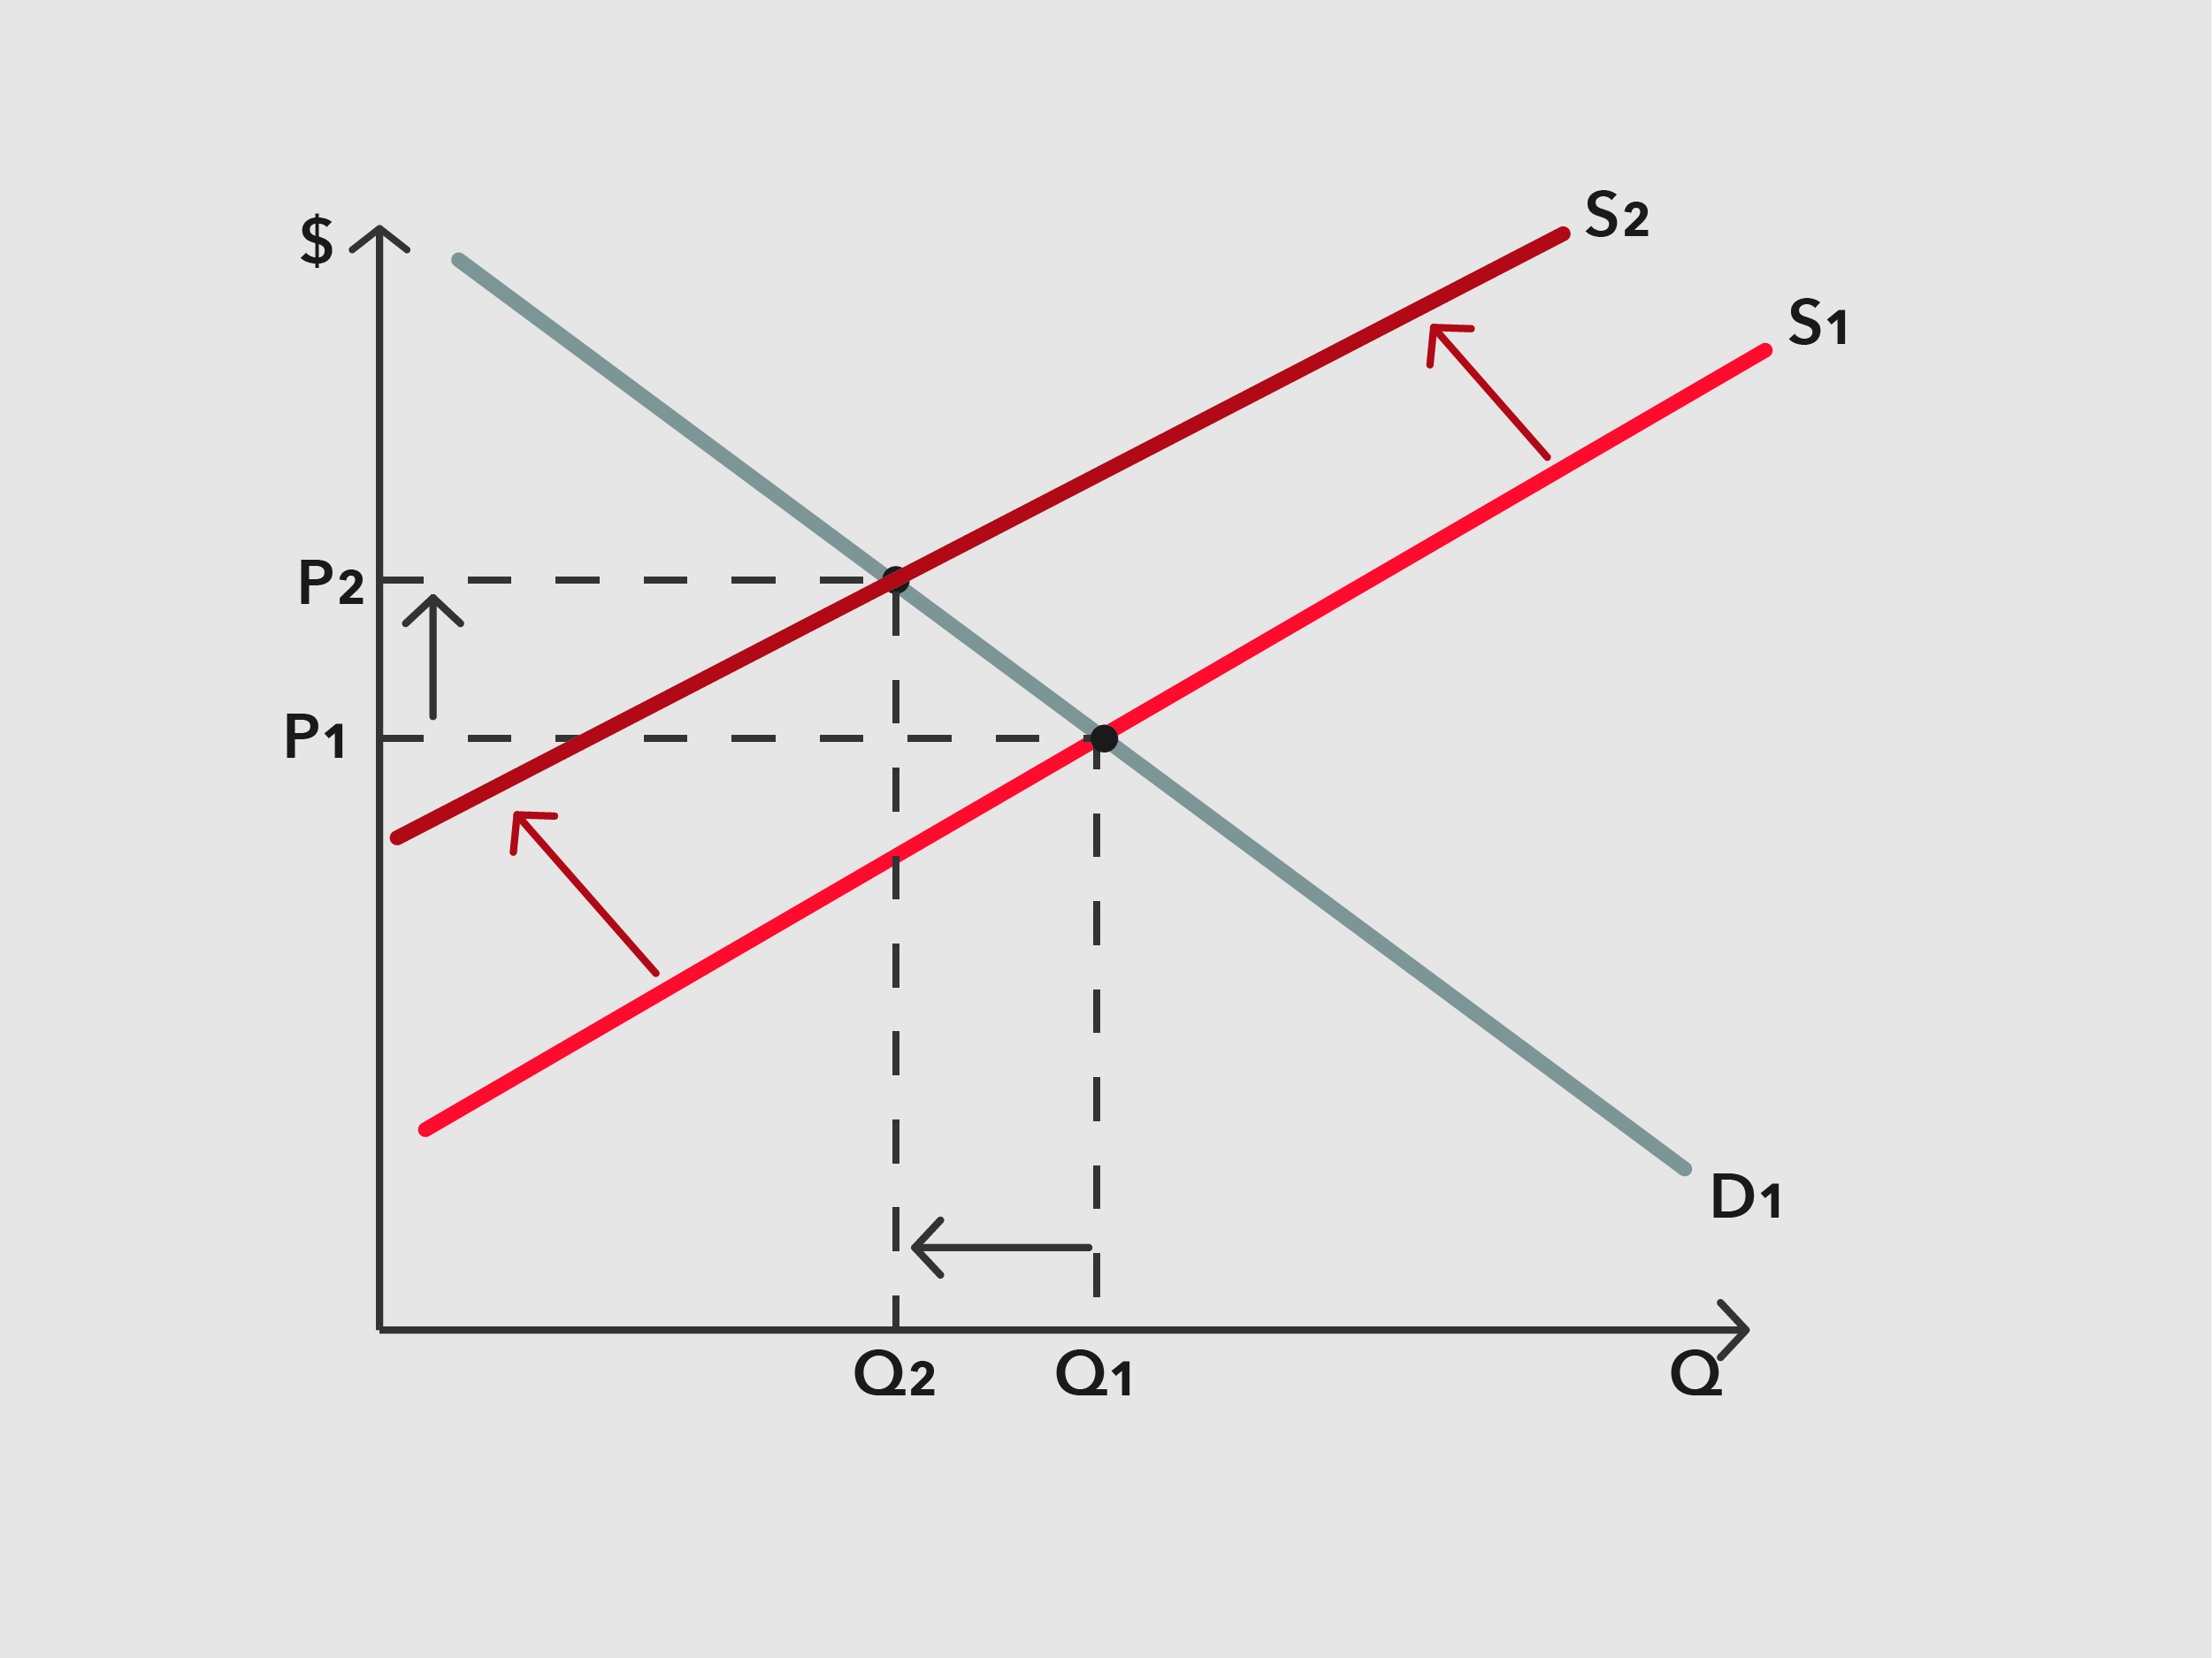
It is common for the supply and demand curves to shift left or right, due to other factors outside of price. When the demand or supply curve shifts, the equilibrium price and quantity change for that commodity.
- When the supply curve shifts left, price increases and quantity decreases.
- When the supply curve shifts right, price decreases and quantity increases.
- When the demand curve shifts left, price decreases and quantity decreases.
- When the demand curve shifts right, price increases and quantity increases.
Factors that can cause the demand curve to shift:
Substitutes
If a better alternative is available, demand for the original product can decrease causing the curve to shift left.
Consumer income change
If a consumer earns a higher income, demand will increase causing the curve to shift right for certain commodities.
Complements
A compliment is a good or service that is often bought in conjunction with another good or service.


Factors that can cause the supply curve to shift:
Changes to input prices used to produce another commodity
If the price of steel rises, it will lower the supply (shift left) of automobiles.
Advancement in technology
More efficient engineering will increase the supply of computers (shift right).

How Supply and Demand Translate to Logistics
In the case of the logistics industry:
- Carrier Capacity is the number of trucks available (supply).
- Shipper Demand is the number of shipments that shippers want to move (volume).
- Price on the Y-axis is the rate and the quantity on the X-axis is the volume.
- The point at which the two curves intersect is the “market rate.”

Overview
These are the laws that govern the shifts in supply and demand. You can see how the laws translate into the logistics market:
- When the supply curve shifts left, price increases.
- When the supply curve shifts right, price decreases.
- When the demand curve shifts left, price decreases.
- When the demand curve shifts right, price increases.
- When capacity decreases, rates increase.
- When capacity increases, rates decrease.
- When shipper demand decreases, rates decrease.
- When shipper demand increases, rates increase.
How to Interpret Supply and Demand in Logistics
When shipper demand is higher than available carrier capacity (supply), rates increase because shippers must pay the limited number of trucks more than their competition to get their shipment moved. This is called a “tight market” or “hot market” in favor of carriers.
When carrier capacity (supply) is higher than shipper demand, rates decrease because there are more trucks available than loads, meaning trucks are in competition with each other to take shipments for lower rates. This is also known as a “loose market” or “shipper’s market” in favor of shippers.
Logistics indicators that shift supply:
Class 8 Truck Orders
Logistics indicators that shift demand:
Purchasing Manager's Index (PMI)
The Purchasing Manager’s Index is a measure of the direction of economic trends in manufacturing. Covering 19 industries, including both upstream and downstream activity. PMI is a leading indicator of overall economic activity in the U.S.
When the PMI indicates an expansionary manufacturing economy, we can expect volume to increase as there are more goods that need to be moved. When the PMI indicates a contractionary manufacturing economy, we can expect shipment volume to decrease. All else equal, an increase in shipment volume will increase rates while a decrease in shipment volume will decrease rates.
You can find the latest data on the PMI data at Trading Economics
Take Away
After learning about the basic principles of supply and demand and the various economic factors affecting the industry, you can now better understand insights.
Take your knowledge and apply it to FWF’s Q2 2022 Market Insights to stay in tune with current market trends.