
Why FWF Market Insights?
Stay up-to-date on industry trends with FWF’s market analysis. The logistics and transportation industry is constantly moving. Understanding the fundamentals of how rates are affected and staying relevant to trends begins with understanding supply and demand. It is vital for your business planning and market knowledge.
If you want to learn more, check out FWF’s Basic Breakdown of Supply and Demand.
Truckload Rates
Using spot and contract data from DAT, FWF aggregated the monthly and quarterly linehaul rate-per-mile for reefers, flatbeds, and dry vans to determine the average for all three trailer types combined.
|
Quarterly Contract RPM Excluding Fuel |
Quarterly Spot RPM Excluding Fuel |
|||||
|
Quarter Average |
RPM |
% Change |
Quarter Average |
RPM |
% Change |
|
|
Q4 2021 Average |
$2.68 |
+2.3% |
Q4 2021 Average |
$2.70 |
+2.7% | |
|
Q1 2022 Average |
$2.75 |
+2.6% |
Q1 2022 Average |
$2.74 |
+1.4% |
|
|
Q2 2022 Average |
$2.79 |
+1.4% |
Q2 2022 Average |
$2.31 |
-15.8% |
|
|
Q3 2022 Average |
$2.70 |
-3.2% |
Q3 2022 Average |
$2.12 |
-8.2% |
|
|
Q4 2022 Average |
$2.62 |
-3.0% |
Q4 2022 Average |
$1.97 |
-7.1% |
|
You can find the most up-to-date RPM data by trailer type on DAT.
Typically, contract rates lag behind spot rates by a few months, as contracts are given at the beginning of every quarter or year, though this year contract rates have barely inched towards spot rates. According to DAT Freight & Analytics, spot rates quickly decreased 15.8% in the second quarter of this year, followed by two more steep declines in the third and fourth quarters as they deflate from record highs recorded during the pandemic.
While we typically see contract rates follow a similar pattern at a later date, they declined just 3.2% in the third quarter, followed by 3.0% in the fourth quarter. The trajectory of both contract and spot rates suggests that contract rates will continue to decline in the coming months as they continue to operate ~25% above the spot market.

This chart was created by FWF using aggregated RPM data from DAT.
Peak holiday shipping season provided a small boost in spot rates in December, increasing 4.1% m/m according to DAT. FreightWaves reports their National Trucking Index, which measures average dry van spot rates, jumped almost 10% in the last two weeks of December, reaching its highest levels since summer. While an increase in rates did occur this year, it was much smaller than what is typically observed during peak season. A large contributor to the muted seasonal spike in spot rates is related to the over supply of trucks, as DAT reports equipment posts on their load board hold at six-year highs.
Tender rejection rates also typically see a significant boost as the holiday season unfolds in December. Sonar’s Outbound Tender Rejection Index increased from its multi-year low of 3.9% to 5.8%, where it has since flattened out. The lack of increase is largely due to the fact that contract rates are still elevated far above spot rates, thus carriers are more likely to accept the loads tendered to them as they are more profitable.
Diesel Prices
According to the EIA, the national average cost of diesel reached a record high in June of this year, providing challenges for carriers. Although the cost did deflate into the third quarter, we saw a $0.27 increase again between September and November, as the U.S. faced diesel shortages and the demand for fuel increased as it does in the winter. However, by the end of the fourth quarter, the cost reached its lowest value since February 2022.
EIA analysts report diesel supplies and inventory levels are likely to remain limited as global supply constraints continue into the next year, though prices are forecast to decrease to a yearly average of $4.48/gallon in 2023.

This chart was created by FWF using diesel price data from the U.S. Energy Information Administration.
Current Factors Driving the Freight Market
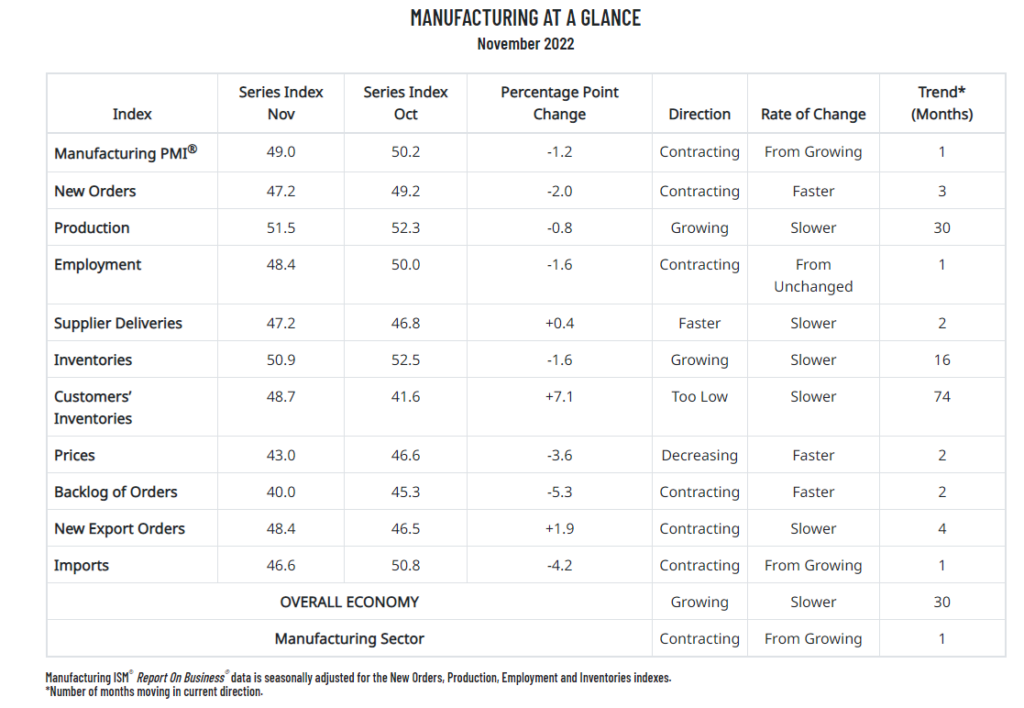
Manufacturing
A majority of freight demand comes from the manufacturing industry, where activity has continued to ease. ISM’s Manufacturing PMI measured 49% in November, the first contractionary reading since May 2020 and down 1.2 percentage points from October.
This index is adjusted for seasonality, indicating that manufacturing activity slowed more than expected, and if this trend continues, freight demand will ease even further in the coming months. ISM reports that manufacturing output may be slowing as supply chain constraints continue to ease and inventories grow, working against industrial production.
Housing
The housing industry is another important indicator of freight volumes, and is also something to watch in the coming months. The single-family housing space has been an area of concern, as single-family housing starts have been on the decline for the majority of the year, decreasing 4.1% m/m in November. Total housing starts have shown more strength, nearly flat m/m in November, indicating that multi-unit homes are in higher demand as they are a more affordable option for consumers.
Despite the strength in multi-unit housing starts, total building permits dropped 11.2% m/m in November, indicating a drop in demand in both housing spaces. On a more positive note, the number of housing units under construction remains elevated far above pre-pandemic levels, leaving a backlog of homes to be built and volume to be added to the freight market.

Consumer Conditions
Consumer conditions remained shaky throughout the last quarter of the year, and is likely a large contributor to the muted holiday shipping season, as inflation leaves wallets tight. While inflation has slowed to 7.1% in November, it is still elevated and continues to provide challenges for consumers, as the savings rate for consumers is at its lowest level since 2005 while credit utilization is on the rise. This trend will continue to slow consumer spending on discretionary goods, in turn slowing the demand for freight.
Conclusion
Q4 is typically a busy season for freight, and although some boosts were provided, they were lackluster. Rates increased, but at a much smaller amount than seen in previous years, and rejection rates plateaued at just 5.8%. Looking ahead into the new year, the first quarter of the year is typically slow for freight. Assistance related to seasonality is over, and the direction of the economy leaves some uncertainty for Q1 2023 expectations for the freight market.
FWF continues to provide customers and carriers with reliable and new information to navigate the freight market with in-depth knowledge and data. Visit FWF’s resource center for more information that can improve your insights.